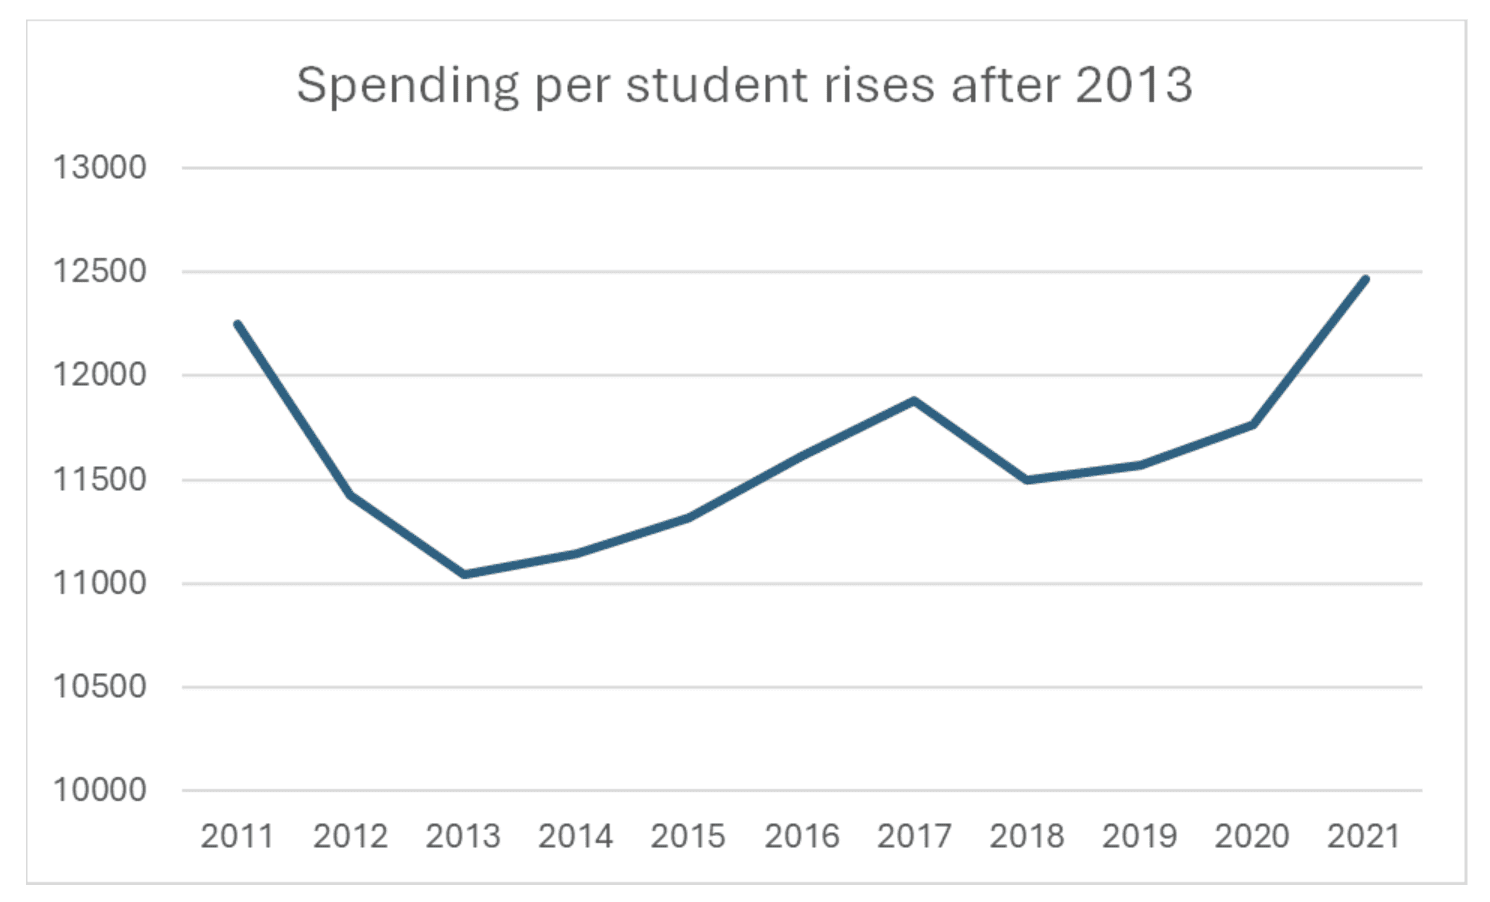
Americans have long thrown money at their schools, and Nevada is no exception. In the United States, spending per student has doubled every half-century, notes the education economist Eric A. Hanushek. In Nevada, spending per student in public schools rose 14% after 2013.
Real Spending per Public Student in Nevada, 2011-2021

What does our money buy us? More buildings and more “other.” Since 1990, the shares that have risen most quickly in the school budget have been for capital outlay (8.4% to 9.8%) and “other services” (17.9% to 19.3). I do not wish to exaggerate: More than half of the budget has always gone into instruction. And that’s the greatest mystery of all.
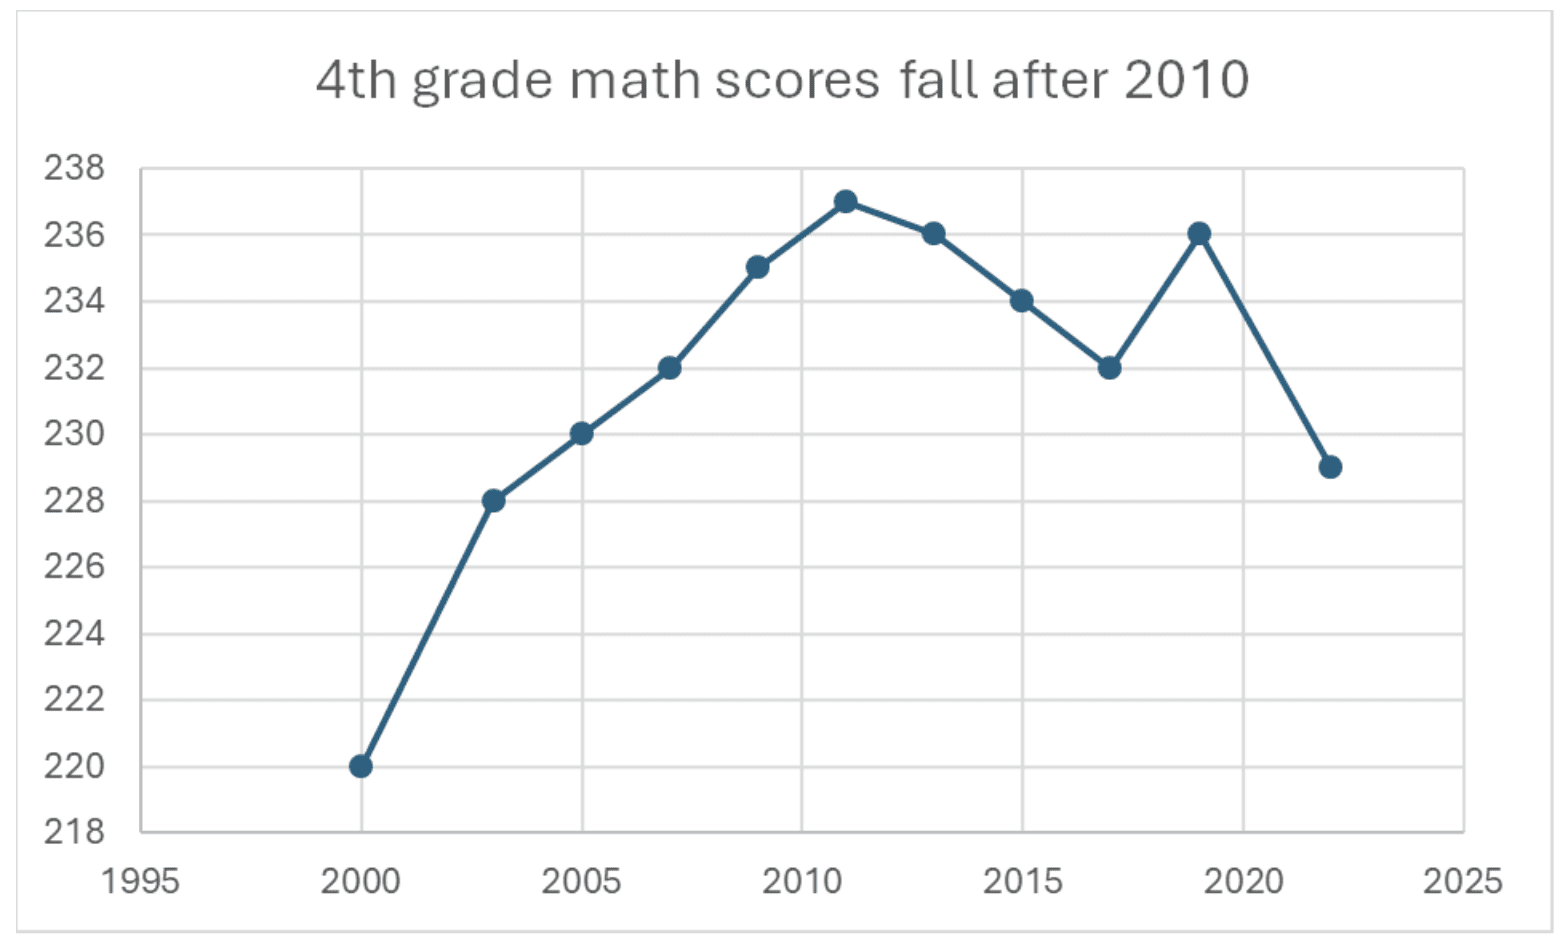
For the money certainly doesn’t buy more learning. When it comes to typical Math assessment scores for 4th grade, Nevada scores are below the national average in every year tested from 2000 to 2022. They improved markedly from 2000 to 2010—and then fell almost as much as they had risen. By 2022, we were back to square one with the same score levels as two decades before. Nevada’s performance cannot be accused of improvement over the long run. Moreover, its gap from the national average has doubled in a decade, from 3 to 6 points.
Nevada Assessment Scores, 2010-2022

More revealing is the share of 4th graders in Nevada with at least basic mastery in math. Only 70% of the 4th graders in Silver State have basic skills in Math – a fall of 10 percentage points over a decade. Furthermore, almost a third of 4th graders lack basic mastery . Much less than a third are proficient. And the share of students with advanced skills has always been in single digits.
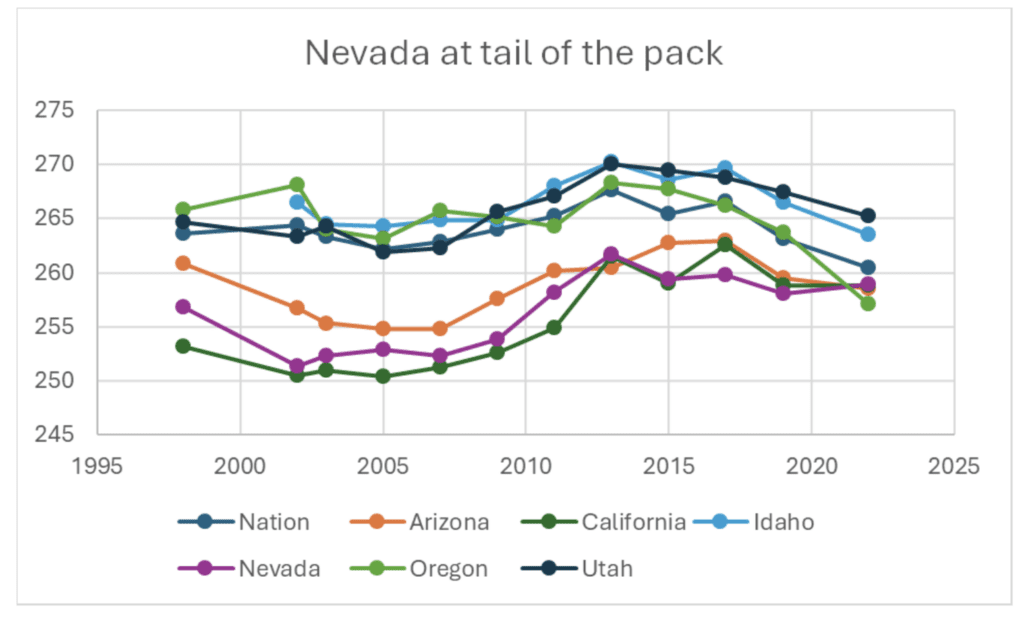
8th Grade Reading Scores in Nevada and Neighbors

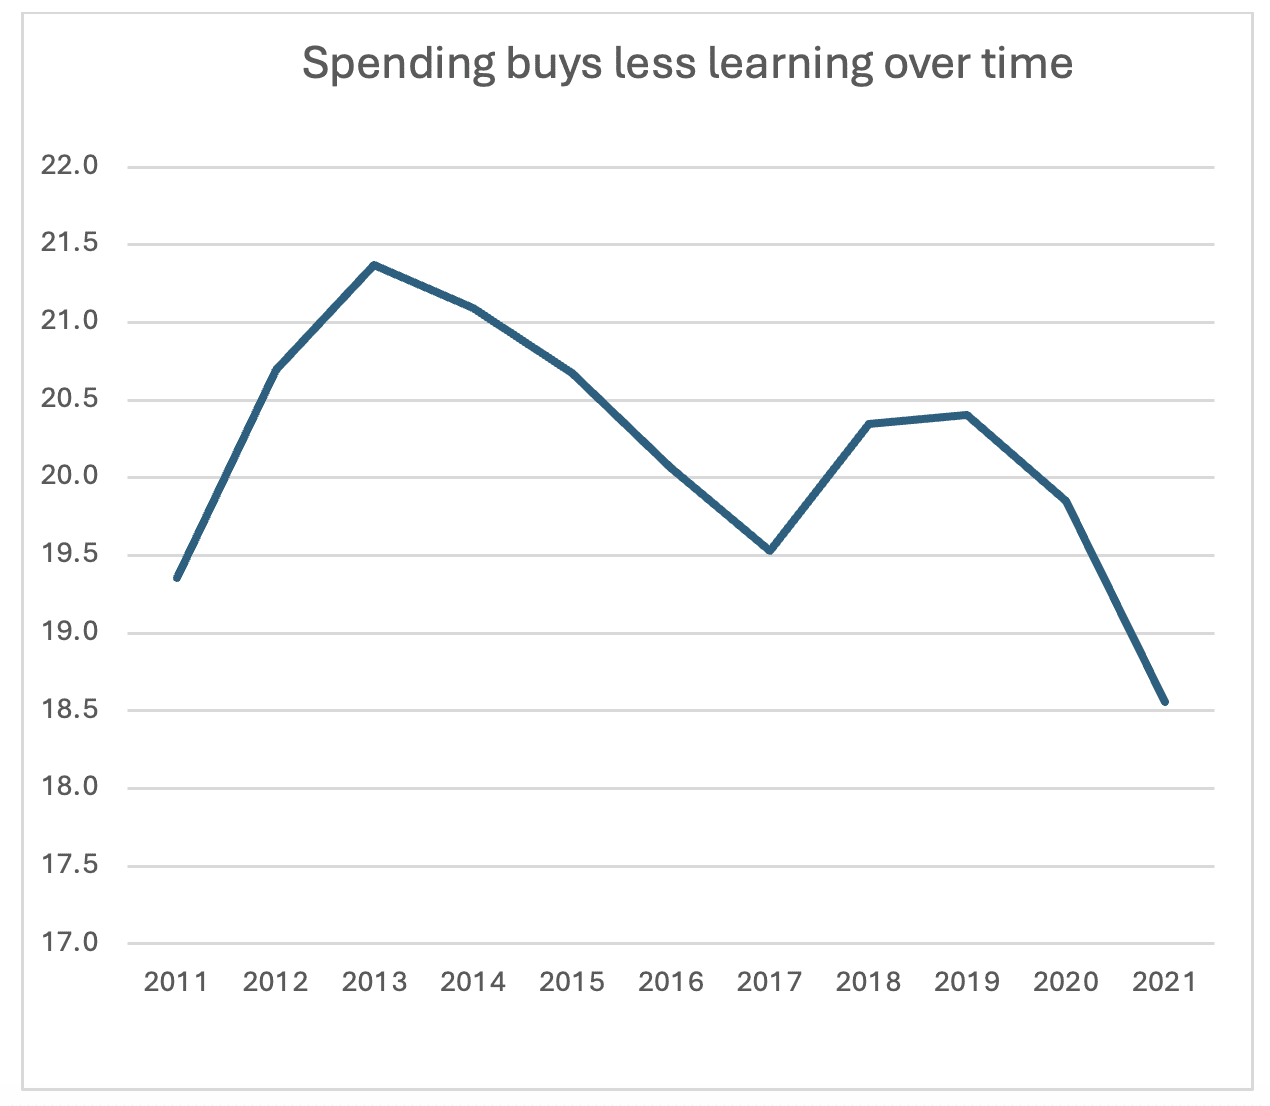
In short, while spending rose in Nevada, performance fell. This is clear when we look at the boost in achievement scores that $1,000 spent on a student may buy. The amount of achievement per $1,000 has fallen by a seventh over a decade. We should not misinterpret this statistic. Of course, student achievement depends on other variables. The point is this: Even under the generous assumption that money does determine all achievement, spending has not enabled students to learn more in Nevada. Quite the contrary.
Gain in 4th Grade Math Achievement Score per $1,000 of Student Spending in Nevada

This is not news. Statistical work for decades has concluded that spending does not much affect student achievement. “Considerable change in the funding of schools has occurred,” notes Hanushek, who has surveyed much of the research, “but it appears to have had little effect on student outcomes.” Using the National Assessment of Educational Progress statistics, which are also the basis for this paper, “performance in 1999 of seventeen-year-olds was roughly the same as that in 1970 across math, reading, and science,” Hanushek writes.
Nevada Education Compared to Other Western States
Such stagnation in the schools is common. Far western United States did not perform better in 2022 than in 1998 in terms of average reading scores for 8th graders on the National Assessment of Educational Progress. Nevada? Consistently near or at the bottom of the pack. At the top was its immediate neighbor Utah, so geography does not affect learning. And although Nevada shared regional and national trends, it performed poorly relative to both—and more poorly than Idaho, Utah, and Arizona, although these states spend less per student.
In 2021, in constant dollars, spending was $12,465 in Nevada; $10,445 in Idaho; $11,141 in Utah; and $12,363 in Arizona. Outspending almost all of our neighbors still yields the lowest academic achievement. The big spender in the region, Oregon ($17,876), also has the lowest test score. We can’t buy learning.
What sparks learning?
Since the Coleman Report of 1966, economists have done scores of statistical studies of factors that might affect student performance. This is usually measured as the score on a standardized test like the National Assessment of Educational Progress. Conclusion: When one controls for family factors such as income and parental education, as well as for diversity in the student body, such factors as teacher salary, spending per student, and classroom size do not affect student performance.
“The studies, of course, do not indicate that resources never make a difference,” Hanushek writes. “Nor do they indicate that resources could not make a difference. Instead they demonstrate that one cannot expect to see much if any improvement simply by adding resources to the current schools.”
One way to address the inefficiency and inequity of educational spending may be to reward teachers and students for gains in achievement scores. Students with the largest gains would qualify for scholarships. Teachers with the greatest number of scholarship recipients in their classrooms would get a pay raise. Students and teachers alike would have an incentive to do better. This is quite possible for Nevada: The 2015 reform of the national No Child Left Behind Act, which required standardized testing of elementary schoolchildren, gives the state more leeway than before in testing.
Maybe it’s time to stop throwing money at schools—and start throwing ideas.
References
Dickinson, Elizabeth Evitts. Coleman Report set the standard for the study of public education | Hub . Johns Hopkins Magazine, winter 2016.
Hanushek, Eric A. (1986). The economics of schooling: Production and efficiency in public schools. Journal of Economic Literature, 24 (3): 1141-1177.
Hanushek, Eric A. (2001). Spending on schools. Chapter 4 of Terry Moe, ed., A primer on American education: 69-88. Stanford, California: Hoover Institution. Hanushek 2001 PrimerAmerEduc.pdf
National Assessment of Educational Progress. The Nation’s Report Card: Nevada. Profiles
National Center for Education Statistics. Digest of Education Statistics 1990.
National Center for Education Statistics. Digest of Education Statistics: Nevada. Digest State Dashboard
National Center for Education Statistics. Digest of Education Statistics: Expenditures for public elementary and secondary education and other related programs, by function: Selected school years, 1919-20 through 2020-2. Expenditures for public elementary and secondary education and other related programs, by function: Selected school years, 1919-20 through 2020-21.
