Across the country, economic activity sharply declined after most state governments ordered most businesses to close in early 2020. Congress responded by authorizing trillions of dollars worth of new federal spending, financed largely by new money printing.
Expansion of Monetary Base and Inflation Trends
Between January 2020 and December 2021, the monetary base—the total amount of dollars the Federal Reserve has placed into circulation—grew 86.3%, according to Federal Reserve data. In January 2020, there were $3.443 trillion in circulation versus $6.413 trillion by December 2021.
This dramatic increase in the money supply occurred alongside a dramatic decrease in the production of goods and services as businesses were forced to close, resulting in historic rates of inflation. Between January 2020 and April 2024, average consumer prices have increased 21.0%, according to the official statistics, with the annual inflation rate peaking at 9.1% in June 2022.
(It’s worth noting that federal statisticians have changed their method of calculating price levels over time by excluding certain categories of goods or financing costs. However, economist John Williams has continued to use the government’s 1980 methodology of calculating average consumer prices at his website ShadowStats, showing annual inflation would have reached 17% in June 2022 under the old methodology.)
Economic Recovery: Nominal Growth vs. Inflation-adjusted Realities
Although production quickly recovered once businesses were allowed to operate, the inflation engineered by the federal government’s response to state-level shutdowns has meant that nominal economic growth disappears when adjusted for inflation.
Recent data released by the federal Bureau of Economic Analysis (BEA) reveals that personal income in the United States declined by 4.2% between 2021 and 2022, while personal consumption expenditures increased by 2.5% after adjusting for inflation. This worsening of household finances occurred even while the economy grew 9.1% in nominal terms.
Nevada vs. National Trends
Moreover, the trends in Nevada are worse than they are nationally. After adjusting for inflation, personal income in Nevada fell 4.5% between 2021 and 2022, while personal consumption expenditures—monies spent to buy food, fuel, housing and other needs—increased by 3.6%, according to the official statistics.
Economic Recovery in Urban vs. Rural Counties
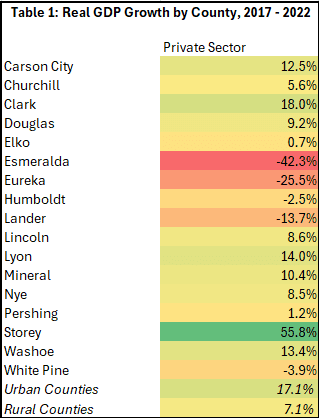
Breaking down these figures even further reveals a sharp divergence in the degree of economic recovery by county. Taken together, private industry in Nevada’s two urban counties—Clark and Washoe—experienced an inflation-adjusted economic output growth between 2017 and 2022 of 17.1%.
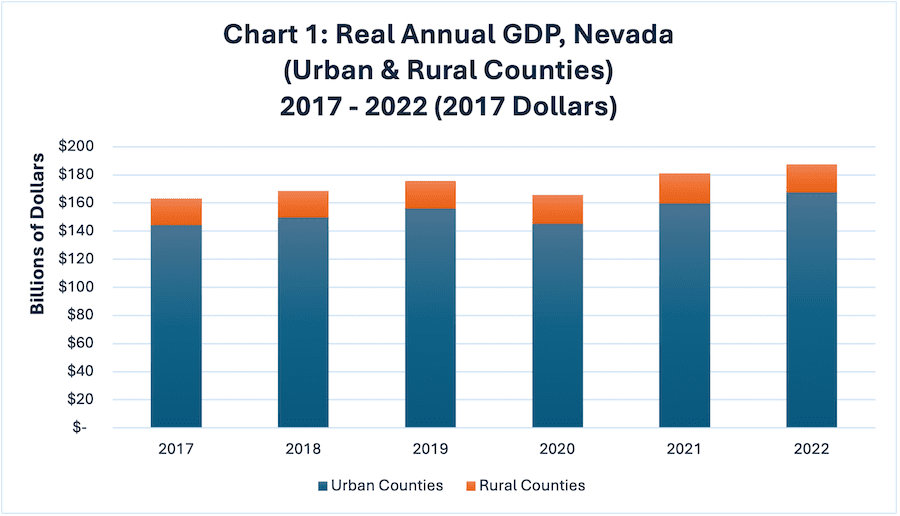
By contrast, private industry in Nevada’s 15 rural counties experienced growth of only 7.1%. Chart 1 shows the rural and urban counties’ annual contribution to Nevada’s gross domestic product.

Impact on Nevada’s Rural Economies
Inflation-adjusted annual output has experienced a significant contraction in mining-dependent rural counties, including Esmeralda, Eureka and Lander. Table 1 displays inflation-adjusted economic growth for each of Nevada’s 17 counties between 2017 and 2022.
Despite robust growth in Storey County, where continued development of the Tahoe Regional Industrial Complex headlined by the Tesla Gigafactory has led to rapid regional growth, Nevada’s rural counties have lagged its urban counties in terms of inflation-adjusted growth. Removing Storey County from the rural counties would reduce five-year economic growth among this group from 7.1% to 2.5%.

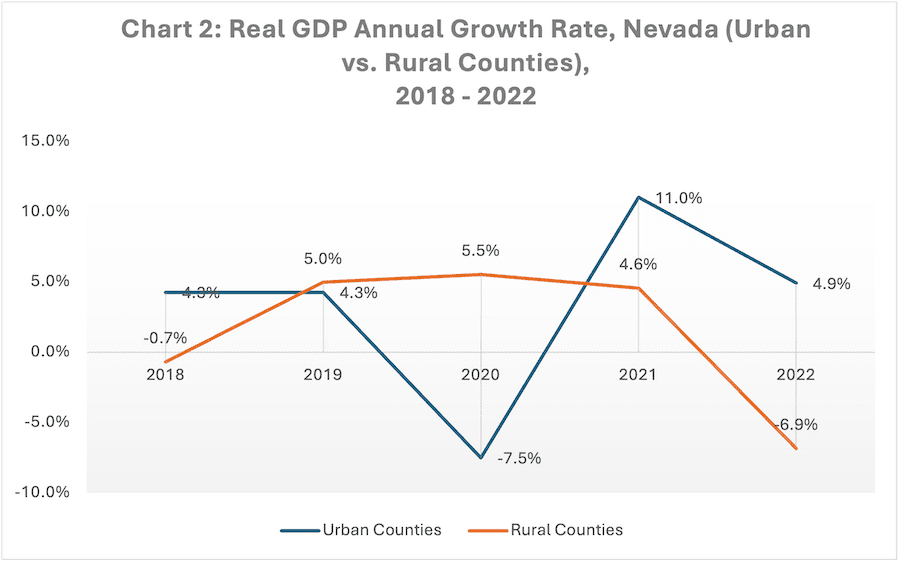
Chart 2 examines this data annually and reveals that Nevada’s rural counties experienced economic growth between 2018 and 2021, but that growth began to reverse in 2022.
By contrast, Nevada’s urban counties experienced a deep contraction during the state-ordered shutdown, but have since recovered that lost growth. These divergent trends indicate that Nevada’s rural counties are getting left behind in the post-shutdown recovery, and several have experienced a sharp contraction in economic output.
 Impact on Government vs. Private Businesses
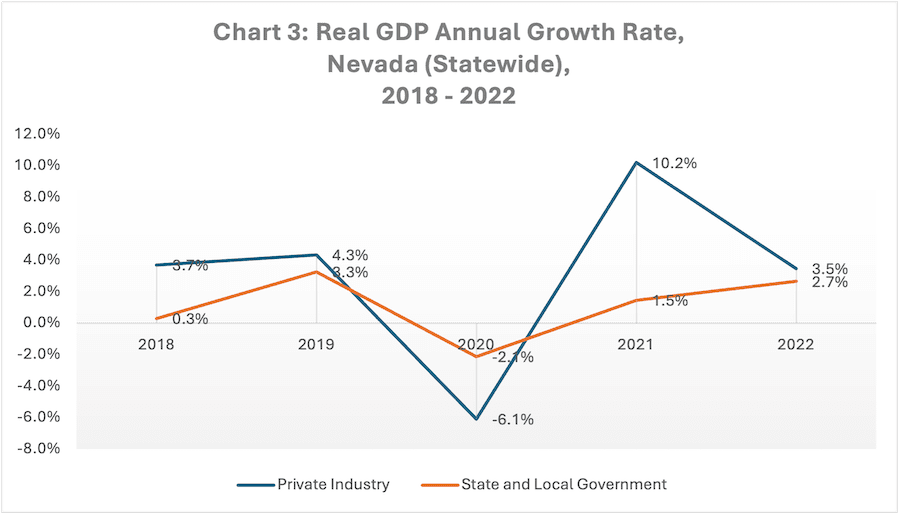
BEA’s recent data release also reveals that economic volatility has been far less pronounced for state and local governments in Nevada than for private industry. As the purveyors of shutdown edicts, governments were not subject to them and governments also benefitted from significant federal largesse through legislations such as the American Recovery Plan Act of 2021 made hundreds of billions of dollars in new grants available to state and local governments, financed mainly through the new money printing that causes inflation.
Chart 3 shows the real annual growth rate of Nevada’s state and local governments compared to private industry between 2018 and 2022. It reveals that government revenues never declined as steeply nor rebounded as quickly as private industry.

Conclusion: Long-term Economic Effects
The distortions caused by shutdown decrees continue to reverberate throughout the economy, both in Nevada and nationally, and have had a profound impact on individuals’ abilities to finance household expenditures.
Moreover, different communities have experienced these pressures in different ways. Nevada’s rural counties have been left behind in the economic recovery, while state and local governments have faced significantly less volatility than private industry.

Sign up for Nevada Policy’s weekly emails to stay up to date on the most pressing issues facing Nevada.
