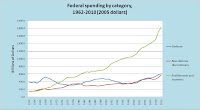
While perusing the Economic Research division of the St. Louis Fed, I just came across an interesting article that asks, “What’s the source of the increase in [federal] spending?” While policymakers in Washington – loathe to enact meaningful fiscal reform – have blown a lot of hot air over earmarks and other “non-defense discretionary spending,” entitlement spending has long been the true driver of federal deficits.
The article points out that transfer payments and entitlement spending combined to account for 70 percent of federal expenditures in 2010 and that these categories are the fastest-growing budget items. Whereas defense spending dwarfed all other categories of federal spending until 1975, it has fallen, as a percentage of GDP, from 15 percent in 1953 to about five percent today. By contrast, spending on Social Security and Medicare has risen, over the same time period, from less than one percent of GDP to about 8 percent today. Combined with transfer payments, these programs cost 16 percent of GDP in 2010. Defense plus non-defense discretionary spending accounted for only 7 percent of GDP in 2010.
These figures leave Fed researchers to conclude thusly:
This analysis suggests that the increase in the debt over the period 1975-2007 was not only a consequence of increased government spending without increased revenues, but also that the government increased payments to individuals through Social Security, Medicare, and other payments without sufficiently reducing spending elsewhere in the budget. In short, these trends, as the CBO’s recent Long-Term Budget Outlook makes clear, will continue to strain federal, state, and local budgets as they consume an ever larger percentage of federal spending dollars.
The article sparked my curiousity and so I visited the authors’ source data – housed within the Office of Management and Budget – and constructed my own chart. This pretty much tells the story:
